These reports are based primarily on data obtained from water commissioners.
The Distribution Plan Reports give monthly accounting of year-to-date storage use each year.
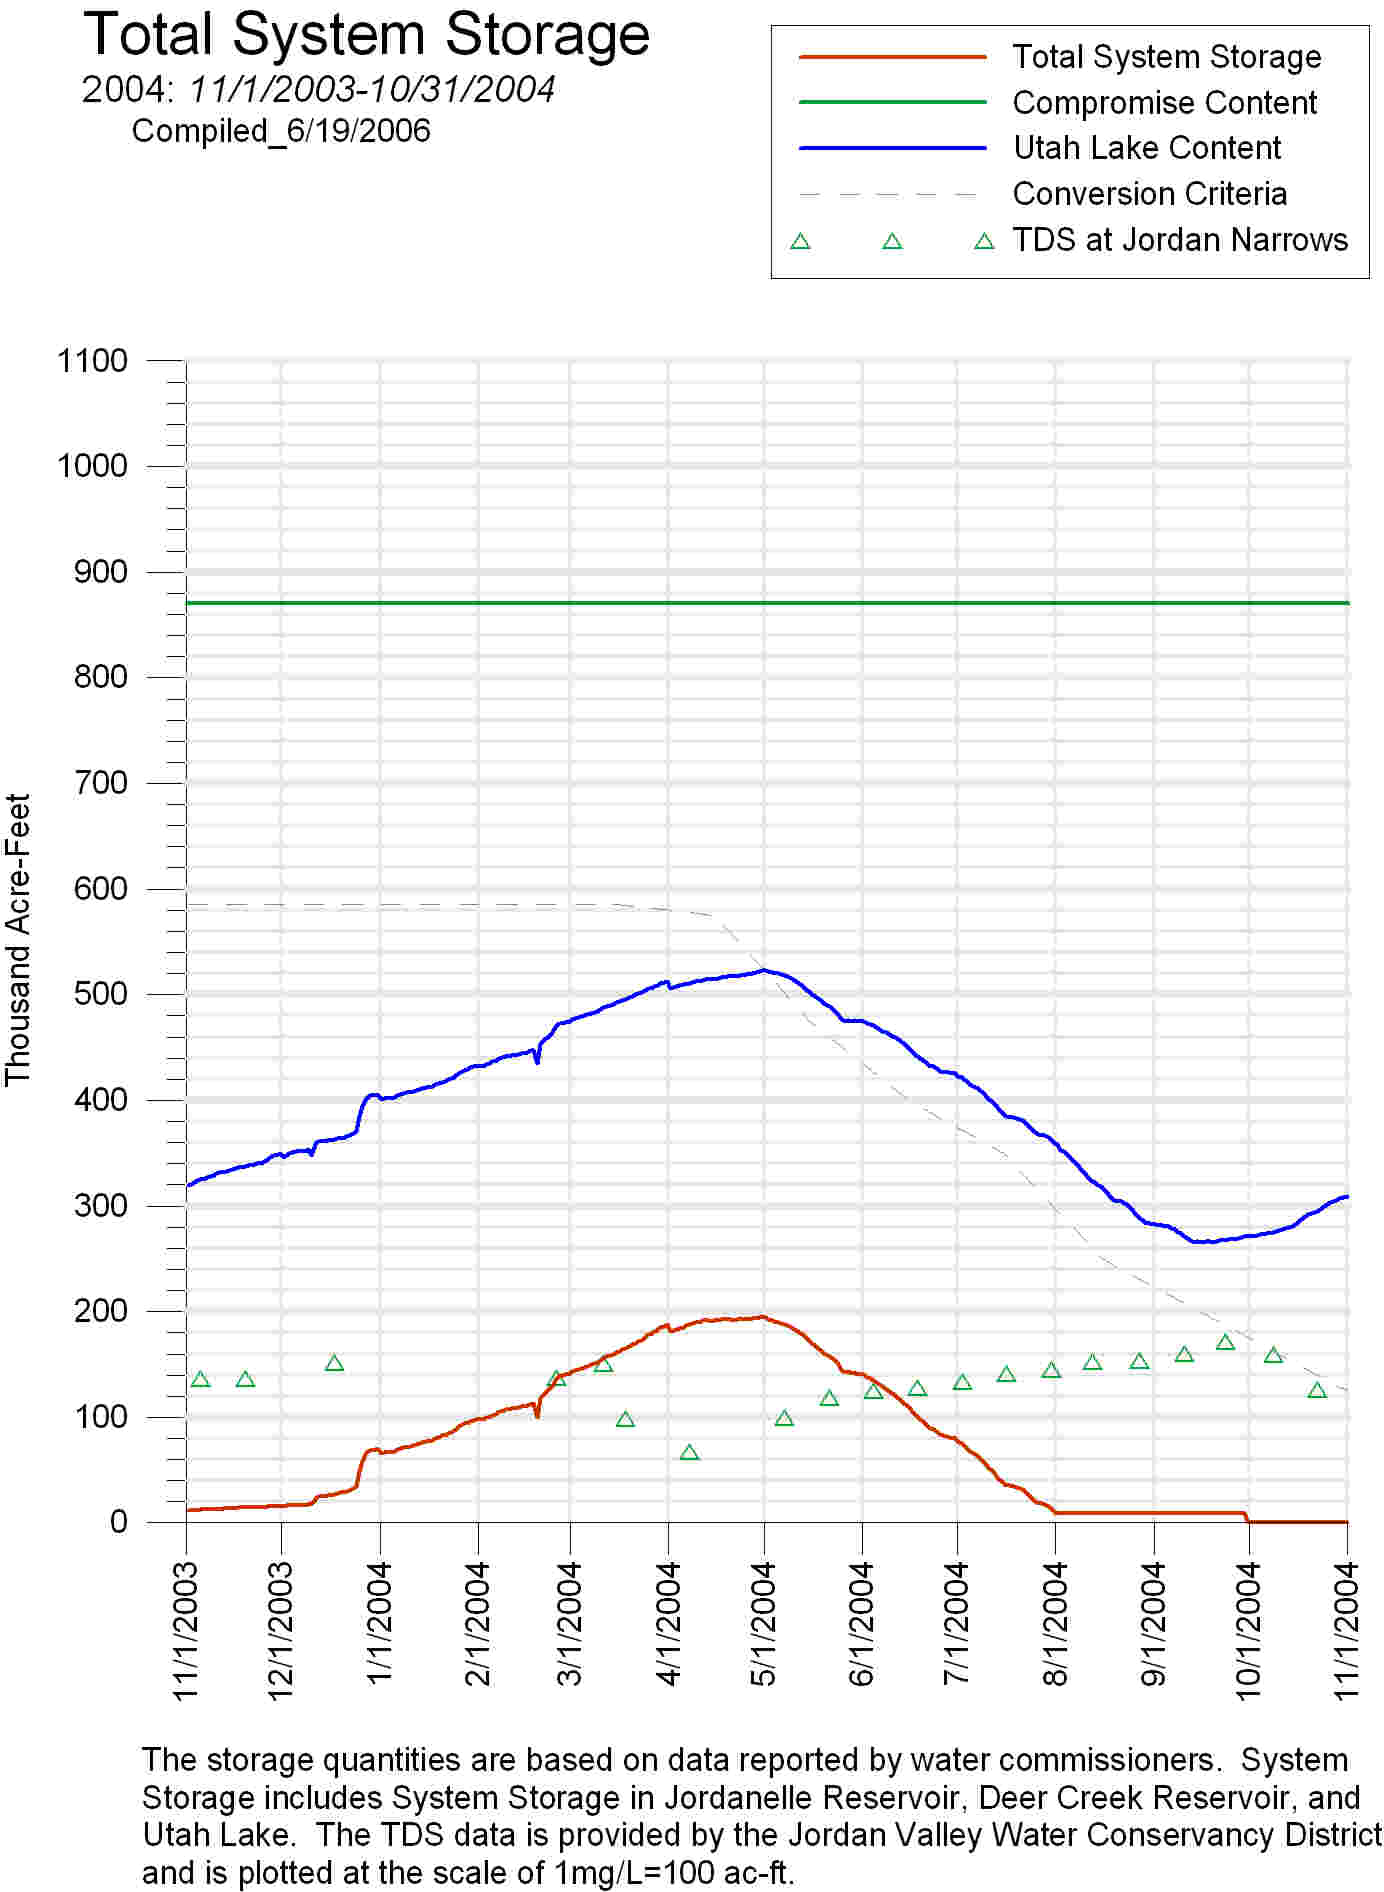
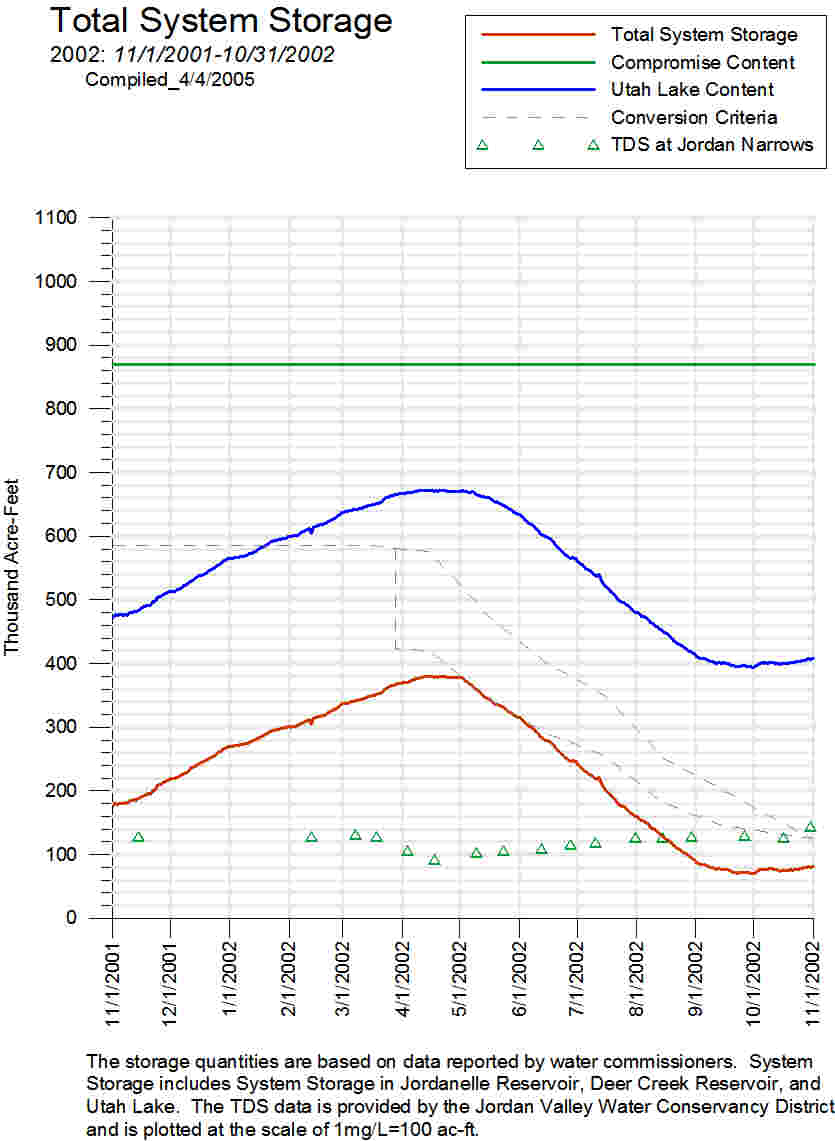
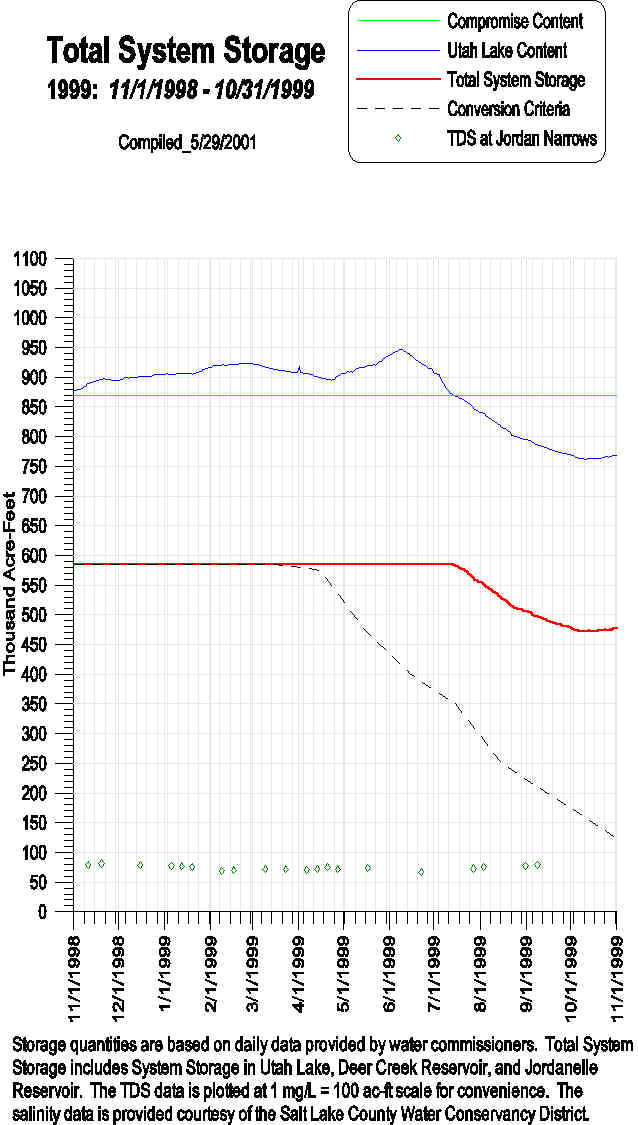
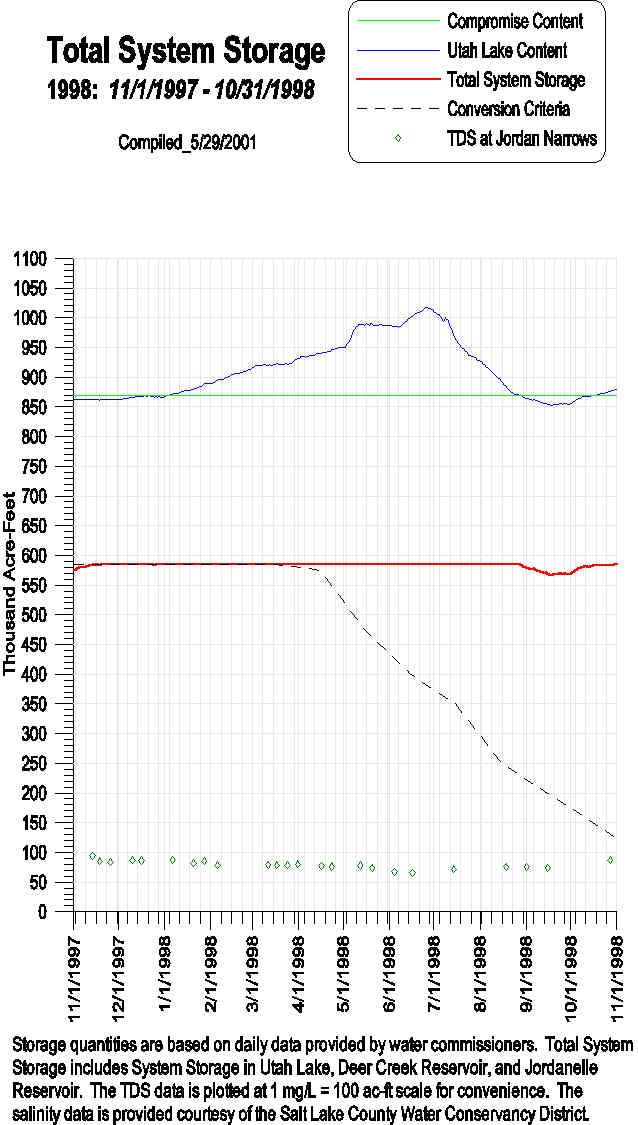
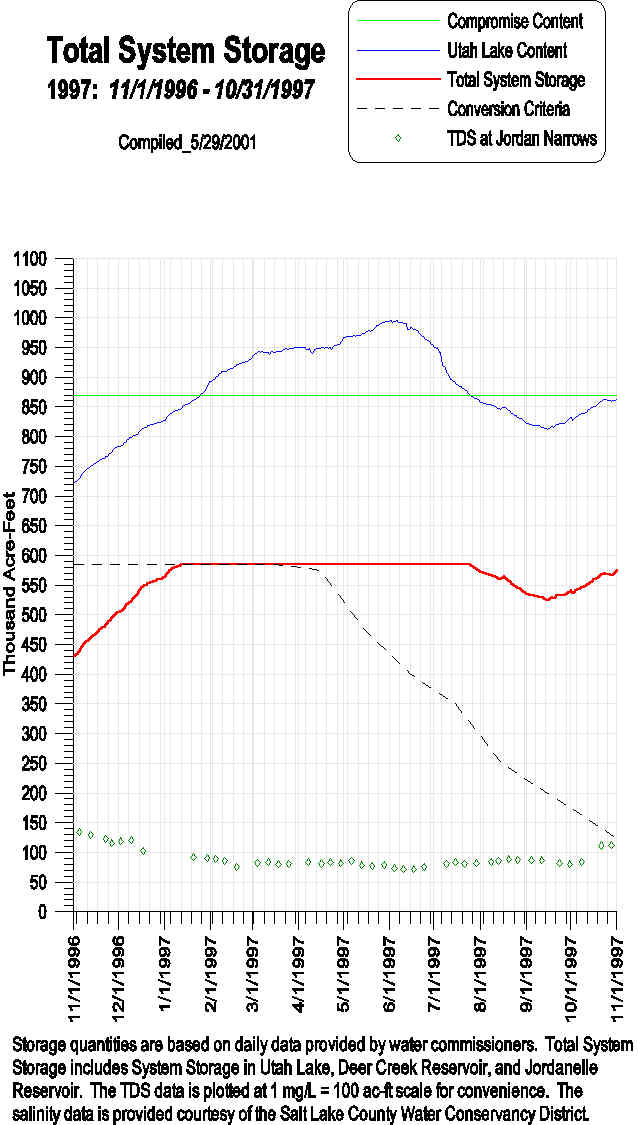
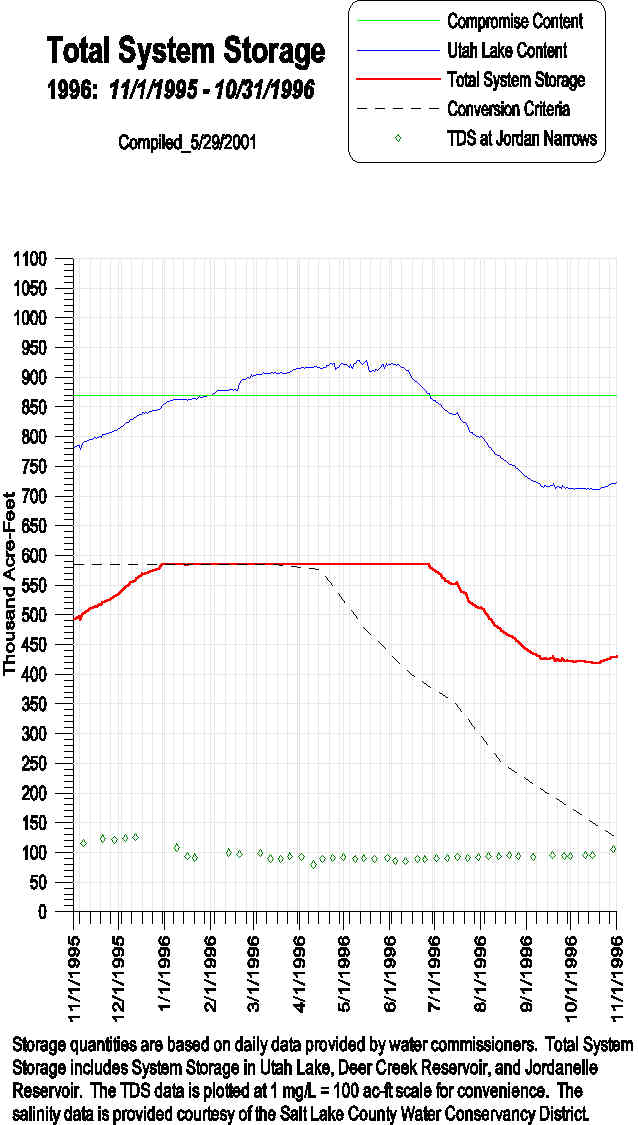
Annual graphs of System Storage are linked below. A continuous graph is also available in jpg or pdf.
The table below shows daily reservoir operation data summarized in the Distribution Plan Reports.
| System Storage Graphs and Reservoir Operation Reports | ||
|---|---|---|
| Total System Storage and Utah Lake Content | Deer Creek Reservoir Operation | Jordanelle Reservoir Operation |
| 2004 | 2004 | 2004 |
| 2003 | 2003 | 2003 |
| 2002 | 2002 | 2002 |
| 2001 | 2001 | 2001 |
| 2000 | 2000 | 2000 |
| 1999 | 1999 | 1999 |
| 1998 | 1998 | 1998 |
| 1997 | 1997 | 1997 |
| 1996 | 1996 | 1996 |
| 1995 | 1995 | 1995 |
| 1994 | 1994 | 1994 |